
Ownership distribution in the ETF market - DD.
I've been looking for this date of myself for quite some time, and now we have it, and a big thank you to Sanjay, who dug it up!
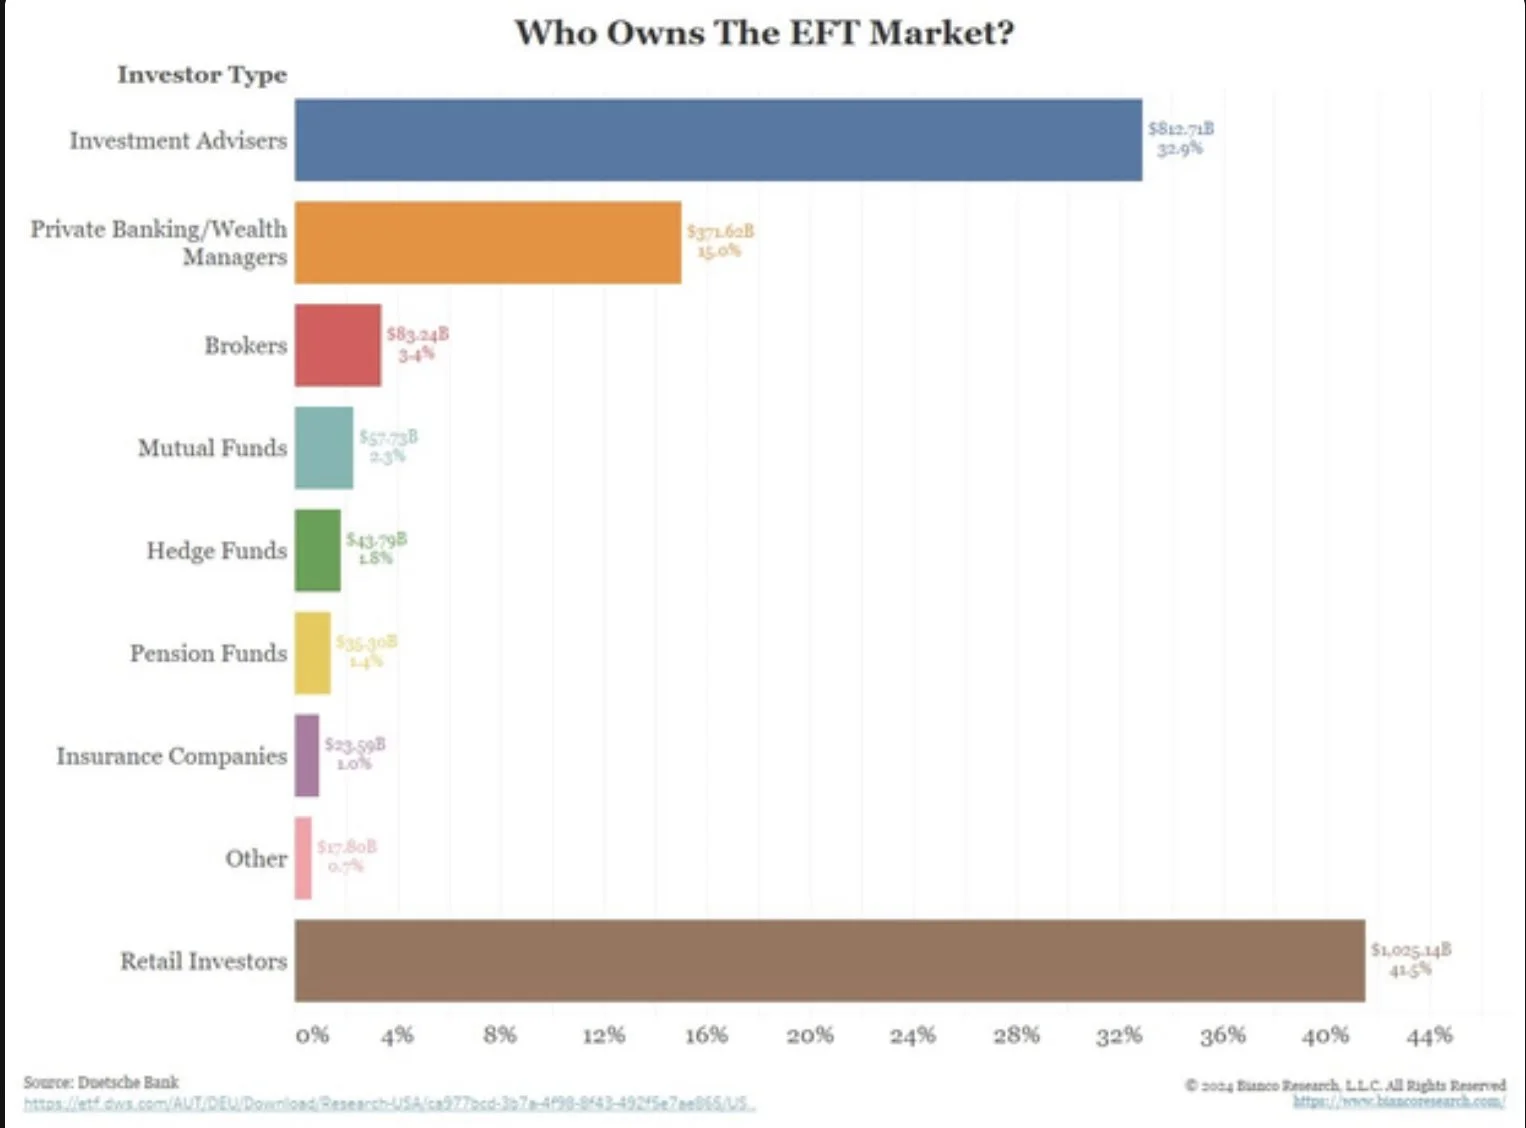
The chart shows the ownership distribution in the ETF market:
Retail Investors: 41.5% ($1,025.14B)
Investment Advisers: 32.9% ($812.71B)
Private Banking/Wealth Managers: 15.0% ($371.62B)
Brokers: 3.4% ($83.24B)
Mutual Funds: 2.3% ($57.73B)
Hedge Funds: 1.8% ($43.79B) [I see this growing a lot over the next few quarters.]
Pension Funds: 1.4% ($35.30B). [I see this growing a lot over the next few quarters.]
Insurance Companies: 1.0% ($23.59B)
Other: 0.7% ($17.80B)
Retail investors own the largest share, followed by investment advisers and private banking/wealth managers. The remaining ownership is distributed among various entities, each holding less than 4%.
Source: Deutsche Bank